
Datadog outages and problems
User reports, last 24 hours
1 report in total, counted in 15-minute windows
No problem reports came in for Datadog in the last hour, and at this time of day there are usually almost none. Over the last 24 hours there were 1 report. The last spike in reports was 81 h ago and lasted 21 min. These are user reports from the US, where most people report Datadog problems.
Around the world right now: normal in 71 other countries. By country
- NormalClose to the usual level24 h · 1 report
- ElevatedMore than 1.5 times the usual levelNone in this chart
- OutageMore than twice the usual level and far above the day's averageNone in this chart
- Usual levelWhat a usual day sees at that timeAlmost none at this time of day
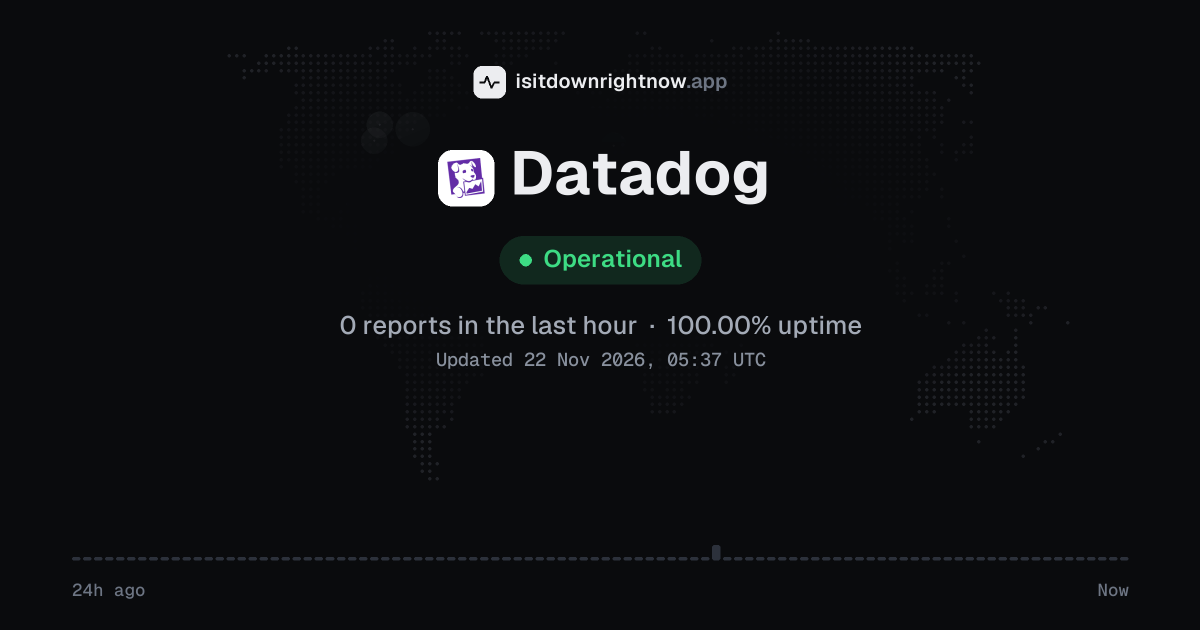
In the past 24 hours, 1 user report came in for Datadog. Counting only the 15-minute windows with a spike big enough to count as an outage, that comes to 100.00% uptime for the day.
The busiest 15-minute window had 1 report, about 9 hours ago. That stays below our outage threshold, so it doesn't count as downtime.
What Datadog's status page says
Checking status.datadoghq.com…
Datadog in November 2026
- Problem reports in November
- 167
- Outage spikes
- 1
- Periods of elevated reports
- 0
Monthly report for November 2026
People who report a problem with Datadog to the outage-report feed behind this page can tag what is affected. These are the categories they can pick; the feed shows no counts per category:
- Website
- Login
- App
Datadog reports around the world
In the last 24 hours, 5 problem reports about Datadog came in from 2 countries. Right now reports are at the usual level in every country.
- Outage now
- Problems now
- Normal
| Country | Now | Last hour | 24 hours |
|---|---|---|---|
| The US numbers above | Normal | 0 | 4 |
| Algeria | Normal | 0 | 1 |
| The UK | Normal | 0 | 0 |
| India | Normal | 0 | 0 |
| The Netherlands | Normal | 0 | 0 |
| Spain | Normal | 0 | 0 |
| Brazil | Normal | 0 | 0 |
| Germany | Normal | 0 | 0 |
| Argentina | Normal | 0 | 0 |
| Belgium | Normal | 0 | 0 |
| France | Normal | 0 | 0 |
| Italy | Normal | 0 | 0 |
Each country's status compares its reports with the usual level there. 60 more countries had 0 reports in the last 24 hours. Map outlines: Natural Earth.
Datadog problem spikes, last 30 days
Since 25 October, Datadog had 2 outage spikes. The longest lasted 2 h, on 28 October.
- Sat 24 Oct: no data
- Sun 25 Oct: 2 reports
- Mon 26 Oct: 0 reports
- Tue 27 Oct: 0 reports
- Wed 28 Oct: 35 reports (outage spike that day)
- Thu 29 Oct: 12 reports
- Fri 30 Oct: 6 reports
- Sat 31 Oct: 2 reports
- Sun 1 Nov: 0 reports
- Mon 2 Nov: 6 reports
- Tue 3 Nov: 5 reports
- Wed 4 Nov: 7 reports
- Thu 5 Nov: 5 reports
- Fri 6 Nov: 1 report
- Sat 7 Nov: 1 report
- Sun 8 Nov: 1 report
- Mon 9 Nov: 0 reports
- Tue 10 Nov: 6 reports
- Wed 11 Nov: 5 reports
- Thu 12 Nov: 16 reports
- Fri 13 Nov: 27 reports
- Sat 14 Nov: 1 report
- Sun 15 Nov: 0 reports
- Mon 16 Nov: 19 reports
- Tue 17 Nov: 18 reports
- Wed 18 Nov: 36 reports (outage spike that day)
- Thu 19 Nov: 5 reports
- Fri 20 Nov: 7 reports
- Sat 21 Nov: 1 report
- Sun 22 Nov: 0 reports
-
Outage
Wed 18 Nov, 21:24–21:44Lasted 21 min15peak reports
-
Outage
Lasted 2 h130peak reports
By country
In the last 25 days, most Datadog problem reports came from the US (185), Japan (13) and Brazil (12). None of these countries had a day at outage level.
- The USNo spikes185
- JapanNo spikes13
- BrazilNo spikes12
- FranceNo spikes9
- IndiaNo spikes8
- ArgentinaNo spikes7
- CanadaNo spikes7
- AustraliaNo spikes6
- Outage spike
- Elevated reports
- Normal
- No data yet
Each square is one day. It turns red when reports stayed at outage level for half an hour or more, and amber when they stayed above the usual level for an hour or more. The number on the right is the country's total since 29 October 2026, when country history starts. A wider gap marks a Monday. Point at a square, or tap it, for that day's numbers. Days run from midnight to midnight, Central European time.
A spike is a sharp rise in problem reports from users, kept exactly as this page showed it at the time. This history starts on 25 October 2026. Monthly reports for all services
How to fix Datadog not working
Datadog is up on our end, so if it won't work for you, the problem is most likely on your side. Work through these in order:
Your browser tries to reach datadog.com over your own connection, right now. Nothing is sent to us or stored.
Load the app in a private window
A stale session cookie is the usual culprit when one person sees errors and the rest of the team is fine, so sign in again from a private window. If that loads, clear cookies for the Datadog domain in your browser settings and sign back in on a normal tab. Script blockers and privacy extensions can cause the same blank screen, so disable them for this site if the problem comes back.
Check the official status page
The official status page tells you if the trouble sits on their side rather than yours, and it names the products and regions affected. Regional incidents hit one Datadog site while others stay healthy, which is why a colleague in another region can keep working. Note the incident and move on; there is nothing to fix on your end.
Check the Agent on the host
If the missing data comes from your own infrastructure, log in to the host and run `datadog-agent status`, or `sudo service datadog-agent status` on older packages. The output shows whether the Agent reaches the intake endpoint and whether your API key is accepted, and a rejected key or a blocked outbound connection explains empty metrics and logs. Restart it with `sudo systemctl restart datadog-agent` once you fix the config.
Send a flare from the host
Open a support ticket first, then run `datadog-agent flare <case id>` on the host to bundle the Agent config and logs into one archive. This saves you from pasting log lines by hand and gives support the failing checks in context. If the Agent will not start at all, run `datadog-agent version` and put that output in the ticket.
While Datadog is down: what to use instead
- New Relic Use it for application performance monitoring, logs, infrastructure metrics, and alerting while Datadog is unavailable.
- Grafana Cloud Use it to view dashboards and collect metrics, logs, and traces from your services.
- Dynatrace Use it for application monitoring and infrastructure visibility when you need a hosted replacement.
- Prometheus Run it with Grafana to collect and view metrics from systems you control.
Fix Datadog on Windows, Mac, Android and iPhone
Datadog on Windows
- Fix
- Restart the Datadog Agent service via the Windows Services console and verify that your local firewall is not blocking outbound traffic to Datadog endpoints. If using the web platform, clear your browser cache and disable conflicting extensions.
- Check
- Check the Datadog Status Page for active cloud outages, or verify if the Datadog Agent status reports a connection failure. You can also test access to the Datadog web app using an incognito browser window.
ping datadog.comTest whether Datadog's servers replynslookup datadog.comCheck that Datadog's DNS resolvestracert datadog.comTrace where the connection dropsipconfig /flushdnsClear the DNS cache, then reloadDatadog on Mac
- Fix
- Restart the Datadog Agent using the macOS menu bar icon or check your network proxy settings if the web dashboard is unreachable. Ensure your network allows outbound traffic to Datadog's IP ranges.
- Check
- Visit the official Datadog Status Page to check for ongoing cloud service disruptions. You can also check if the Datadog Agent is running locally via the Datadog Agent App.
ping -c 4 datadog.comTest whether Datadog's servers replynslookup datadog.comCheck that Datadog's DNS resolvestraceroute datadog.comTrace where the connection dropssudo dscacheutil -flushcache; sudo killall -HUP mDNSResponderFlush the macOS DNS cache, then reloadDatadog on Android
- Fix
- Force close the Datadog mobile app, clear its storage cache in your system settings, or update it via the Google Play Store. If issues persist, try switching from Wi-Fi to mobile data.
- Check
- Check the Datadog Status Page on your mobile browser to see if the cloud service is down. If the status page loads but the Datadog app fails, the issue is likely app-specific or local.
Datadog on iPhone and iPad
- Fix
- Force restart the Datadog app, check for updates in the App Store, or reinstall the app on your device. Ensure that cellular data access is enabled for Datadog in your iOS settings.
- Check
- Check the Datadog Status Page to confirm if the cloud platform is experiencing downtime. If the status page is green, try loading the Datadog web console on a desktop to isolate the issue.
Problems at the same time as Datadog
Since 25 October, all 2 of Datadog's spikes in problem reports overlapped a spike at another service.
When several services get problem reports at once, something they share, such as a cloud host or a network, can be the real cause. Matching times alone do not prove it.
Most often at the same time
How many of Datadog's spikes overlapped one of theirs.
During the latest spike
Datadog: Wed 18 Nov, 21:24 to 21:44
- Microsoft Outlook, outage,12 Nov 17:42 to 21 Nov 13:37
- Microsoft 365, outage,12 Nov 17:59 to 19 Nov 10:34
- Bank of America, outage,16 Nov 15:26 to 19 Nov 09:13
- Chase, outage,16 Nov 15:26 to 20 Nov 10:34
- PlayStation Network, outage,17 Nov 09:05 to 21 Nov 01:17
- Amazon, outage,17 Nov 11:42 to 20 Nov 09:04
- Gmail, outage,17 Nov 12:44 to 19 Nov 07:56
- AT&T, outage,17 Nov 15:10 to 19 Nov 06:14
161 more services. Red dot: outage. Amber dot: elevated reports.
A spike is a sharp rise in problem reports from users, as the live pages showed it. Times are Central European time.
When people report Datadog problems
The busiest hour for reports about Datadog is 21:00 to 22:00 Central European time, and the busiest day is Wednesday.
By hour of the day
- 00:00 to 01:00: 0.19 reports on an average day
- 01:00 to 02:00: 0.15 reports on an average day
- 02:00 to 03:00: 0.07 reports on an average day
- 03:00 to 04:00: 0 reports on an average day
- 04:00 to 05:00: 0.04 reports on an average day
- 05:00 to 06:00: 0.02 reports on an average day
- 06:00 to 07:00: 0 reports on an average day
- 07:00 to 08:00: 0.02 reports on an average day
- 08:00 to 09:00: 0 reports on an average day
- 09:00 to 10:00: 0 reports on an average day
- 10:00 to 11:00: 0.02 reports on an average day
- 11:00 to 12:00: 0.02 reports on an average day
- 12:00 to 13:00: 0.02 reports on an average day
- 13:00 to 14:00: 0.02 reports on an average day
- 14:00 to 15:00: 0.17 reports on an average day
- 15:00 to 16:00: 0.37 reports on an average day
- 16:00 to 17:00: 0.47 reports on an average day
- 17:00 to 18:00: 0.27 reports on an average day
- 18:00 to 19:00: 0.07 reports on an average day
- 19:00 to 20:00: 0.55 reports on an average day
- 20:00 to 21:00: 0.47 reports on an average day
- 21:00 to 22:00: 0.73 reports on an average day
- 22:00 to 23:00: 0.61 reports on an average day
- 23:00 to 00:00: 0.34 reports on an average day
By day of the week
- Monday: 4 reports on an average Monday
- Tuesday: 4.1 reports on an average Tuesday
- Wednesday: 12 reports on an average Wednesday
- Thursday: 6.3 reports on an average Thursday
- Friday: 5.9 reports on an average Friday
- Saturday: 0.71 reports on an average Saturday
- Sunday: 0.48 reports on an average Sunday
Each bar is the average number of user reports in that hour, or on that day of the week, from 46 days of reports since 5 October 2026. The busiest bar is highlighted. Spikes in reports are left out, so one outage does not set the pattern.
What happens when Datadog goes down
Datadog is a monitoring and observability platform that engineering and on-call teams use to watch cloud apps, infrastructure, logs, and traces. An outage interrupts the dashboards and alerts you need when something else is already failing.
Metric graphs and dashboards often stall first, so a panel that normally updates goes blank or holds stale points while you are trying to confirm a deploy. Alert delivery can lag or stop. Log search and APM trace views may time out or return gaps for the same window, and problems are often partial: one region or a subset of integrations can fail while other parts of the app still load. The status at the top reflects whether user problem reports are above their usual level, counted in 15-minute windows over the last 24 hours, not a direct probe from this site; check the official status page at https://status.datadoghq.com/ for a platform incident.
Datadog IP address, servers and network
Checking datadog.com from our server…
Datadog FAQ
Is Datadog down right now?
Why do my Datadog monitors show No Data?
Why is my Datadog agent not reporting data?
Why can't I log in to Datadog with SAML or Google?
Why is my Datadog dashboard blank or showing no hosts?
Service updates from @datadoghq
No posts about problems from @datadoghq in the last 14 days. The latest is from .
Contact Datadog support
Tip: when Datadog is down, its official status page is the quickest way to confirm the cause and see when a fix is expected.
About Datadog
- Category
- Monitoring / Observability
- Country
- United States
Put the Datadog status on your site
Paste one of these into a web page, a blog post or a README: a small badge, or a card with the chart. Both show the same status as this page, based on user problem reports, and link back here.

<a href="https://isitdownrightnow.app/services/datadog/"><img src="https://isitdownrightnow.app/badge/datadog.svg" alt="Datadog status" height="20"></a>[](https://isitdownrightnow.app/services/datadog/)A live card with the chart
The status, reports in the last hour and the last 24 hours, updated every 5 minutes. Use the frame, or the image where frames are not allowed, such as newsletters.
<iframe src="https://isitdownrightnow.app/embed/datadog/" title="Datadog status" width="100%" height="230" style="border:0;max-width:560px" loading="lazy"></iframe>
<p><a href="https://isitdownrightnow.app/services/datadog/">Datadog status</a> from IsItDownRightNow.app</p><a href="https://isitdownrightnow.app/services/datadog/"><img src="https://isitdownrightnow.app/share/datadog.png" alt="Datadog status: problem reports over the last 24 hours" width="600" height="315" loading="lazy"></a>[](https://isitdownrightnow.app/services/datadog/)Badge, frame and image load no scripts from other sites and set no cookies; people who see them on your page load them from our server. More for journalists.
How we track Datadog
The status on this page comes from user-submitted problem reports for Datadog, counted in 15-minute windows over the last 24 hours. Each window is compared with the normal level for Datadog, so a few complaints on a quiet day don't trigger anything, but a sudden jump well above normal does.
When reports climb well above normal, the status here changes to partial outage or major outage and the chart moves with it. This is separate from Datadog's official status page: user reports tend to show a problem early, while the official page confirms the cause. If the two disagree, check both.