OutageSunday 8 November 2026Ended 9 Nov, 00:30
Telenor outage on 8 November 2026
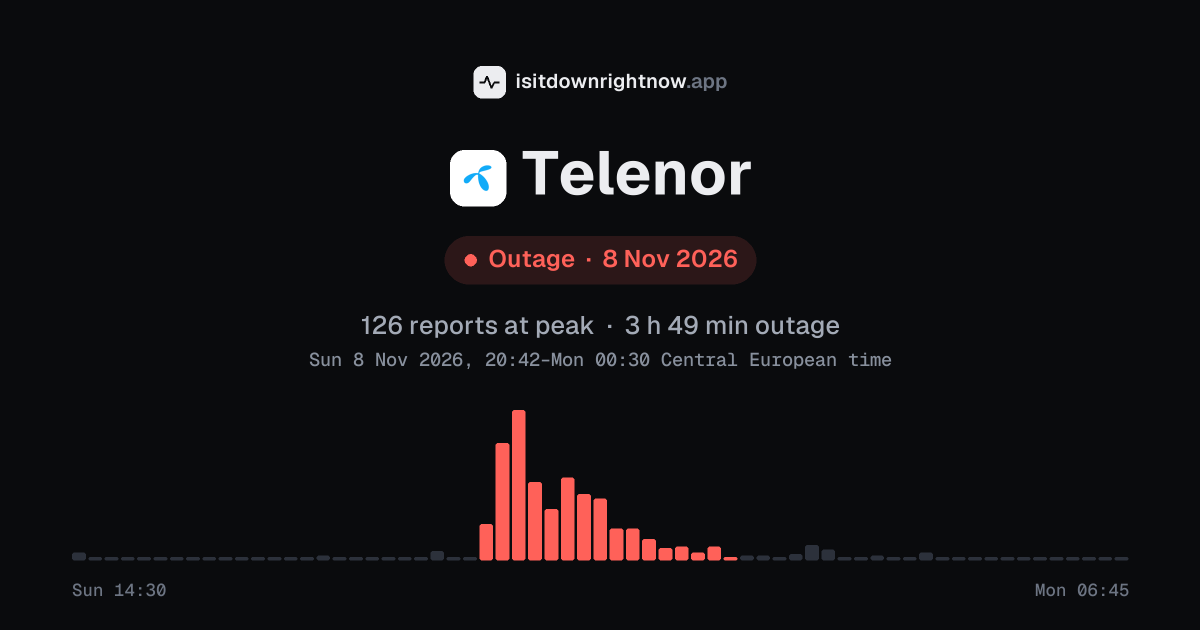
Problem reports about Telenor rose to outage level at 20:42 Central European time on Sunday 8 November 2026 and stayed there for 3 h 49 min.
They peaked at 126 reports in 15 minutes at 21:07, about 126 times the usual level for that time of day, and 517 reports came in while the outage lasted.
Reports reached outage level in Sweden.
12 other services had an outage spike at the same time.
Reports from Sun 14:30 to Mon 06:45
One bar per 15 minutes, Central European time. Red bars are the outage; the dashed line is what a usual day sees at that time.
Where people reported it that day
Each country's reports on 8 November, against the usual level there. Outage means reports stayed at outage level for half an hour or more; above usual, for an hour or more.
| Country | That day | Reports |
|---|---|---|
| Sweden | Outage | 562 |
| Norway | Normal | 88 |
| Denmark | Normal | 46 |
| Pakistan | Normal | 33 |
Other services with an outage at the same time
Their reports also reached outage level while Telenor's did. Many services failing together can point to a shared cause, such as a network or cloud provider, but reports alone cannot show it.
- Outage
22:23–Mon 00:423,505peak reports
- Outage
20:42–21:40354peak reports
- Outage
19:17–22:32295peak reports
- Outage
Mon 00:10–Mon 02:04206peak reports
- Outage
15:00–23:36116peak reports
- Outage
23:58–Mon 02:30114peak reports
- Outage
15:06–Mon 00:2591peak reports
- Outage
19:23–22:4990peak reports
- Outage
22:29–23:2371peak reports
- Outage
21:49–Mon 08:4960peak reports
- Outage
21:27–Mon 01:3456peak reports
- Outage
16:19–Mon 00:3651peak reports
Telenor: live status and other outages
Check whether Telenor is down right now: the live page shows the last 24 hours and fixes to try.
Put this outage in an article
Copy a frame with the chart and numbers above, or an image of the same card for places that do not allow frames, such as newsletters. Both link back to this page. More for journalists.
<iframe src="https://isitdownrightnow.app/embed/telenor/2026-11-08/" title="Telenor outage on 8 November 2026" width="100%" height="230" style="border:0;max-width:560px" loading="lazy"></iframe>
<p><a href="https://isitdownrightnow.app/services/telenor/outages/2026-11-08/">Telenor outage on 8 November 2026</a> from IsItDownRightNow.app</p>
Frame: the chart and numbers, as a small card<a href="https://isitdownrightnow.app/services/telenor/outages/2026-11-08/"><img src="https://isitdownrightnow.app/share/telenor/2026-11-08.png" alt="Telenor outage on 8 November 2026: problem reports over time" width="600" height="315" loading="lazy"></a>Image: the same card as a picture[](https://isitdownrightnow.app/services/telenor/outages/2026-11-08/)Markdown: the image, for README files and forumsWhere these numbers come from
The numbers are problem reports that users sent to a public outage-reporting service, counted in 15-minute windows and kept as this site's live page showed them. A spike counts as an outage when reports are more than twice the usual level and far above the day's average. Reports show that many people had trouble at the same time, not what caused it; the service's own status page is the place for that.